
FIGURE 2. Transmission electron microscopy (TEM) of cardiac tissue sections.
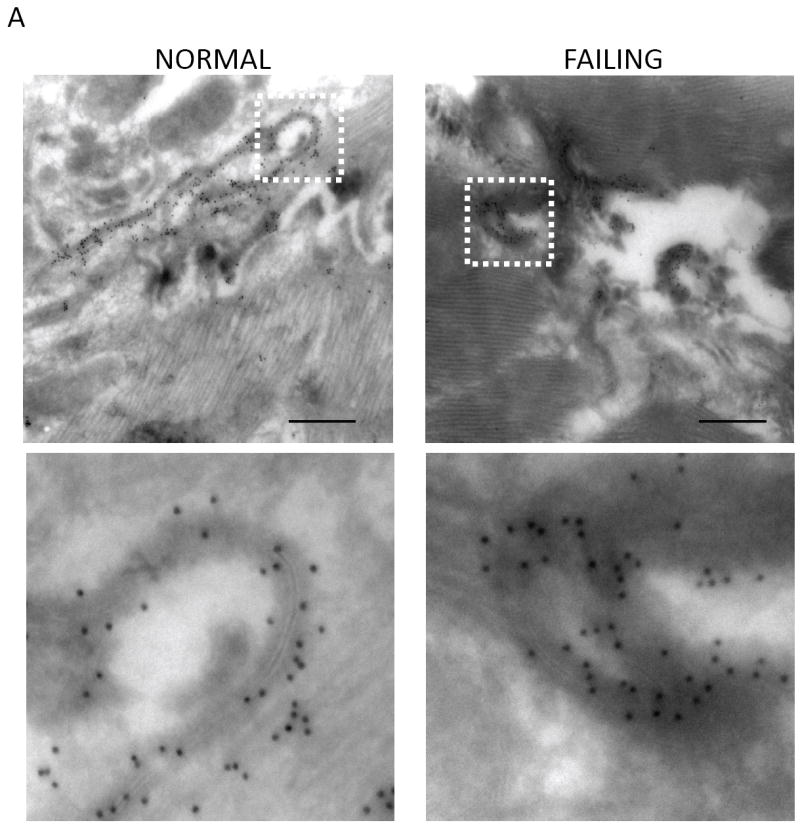
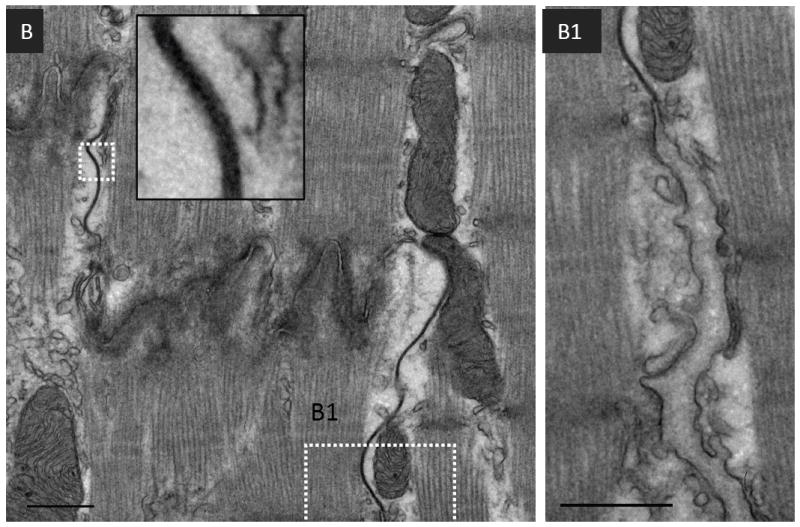
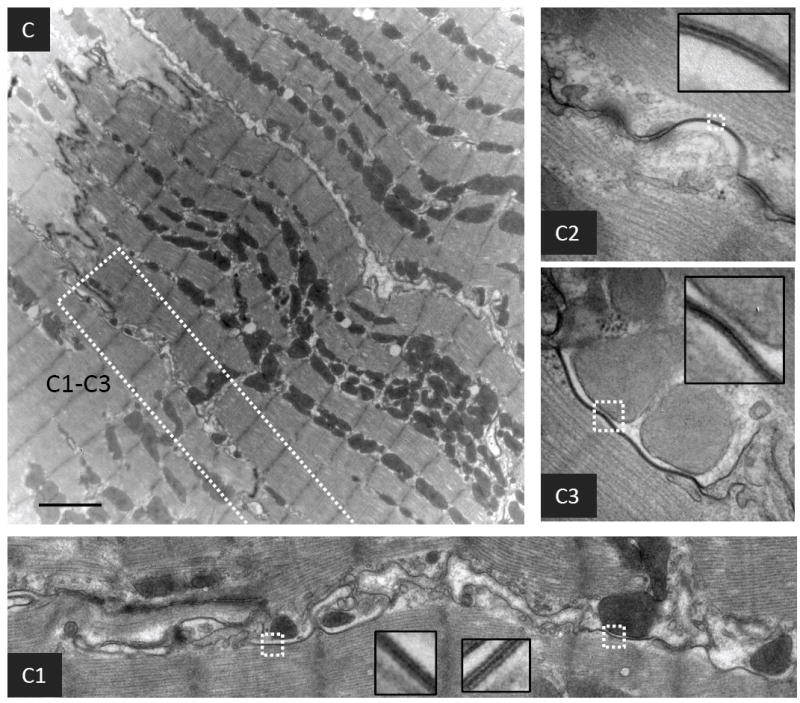
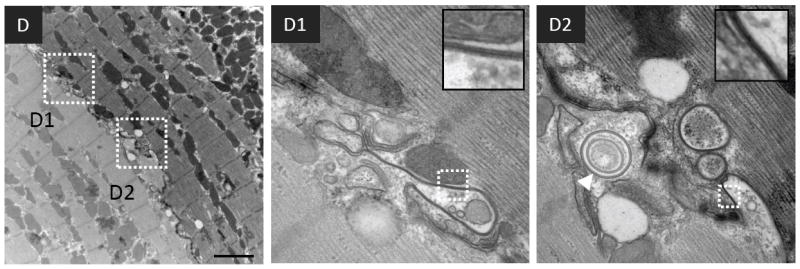
(A) Micrographs of normal and failing canine ventricular tissue sections labeled with anti-Cx43 primary antibody and a secondary antibody conjugated to12 nm colloidal gold then imaged by TEM. The bottom panels show magnified regions of the boxed areas. (B) Conventional TEM of non-failing canine left ventricular tissue sections. The intercalated disk is magnified in the inset. B1 is a magnified and extended view of the boxed region in panel B. (C) and (D) Micrographs of failing canine ventricular tissue sections, highlighting contacts between cardiomyocyte lateral cell borders. C1-C3 and D1-D2 are magnified images from within the boxed regions in panels C and D respectively. The insets in each of the panels are from boxed regions highlighting pentalaminar membranes. A concentric internalized GJ is indicated by a white arrowhead in D2. Scale bars A, B, = 500nm C, D = 2μm