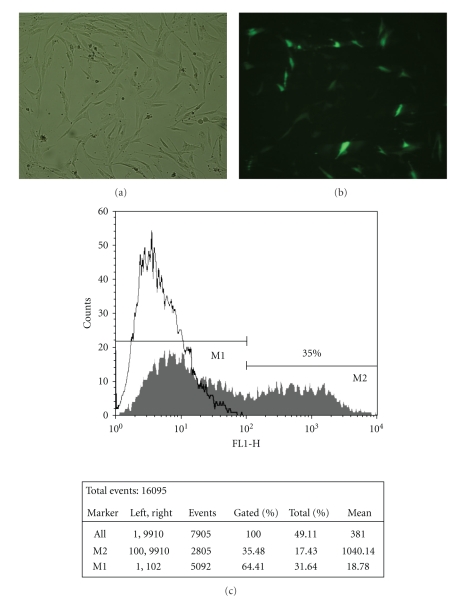
Figure 2.
Bright field (a) and fluorescence (b) microscopic images of lipofectamine-mediated pDNA-GFP transfer in MSC, 24 hours after transfection. Images obtained by fluorescence optical microscopy (100x). Flow cytometry profiles of nontransfected hMSC (white) and hMSC transfected with pDNA-GFP using Lipofectamine2000 L/D = 1.25 (grey) and respective statistical analysis (c).

