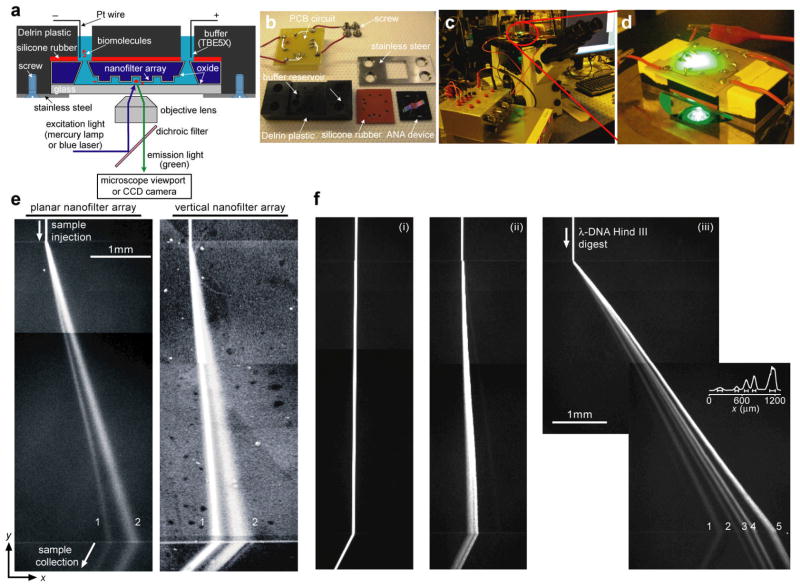
Figure 3.
Experimental setup for separation of biomolecules through the ANA. a shows the schematic of the home-made Delrin plastic gadget holding the ANA. The biomolecules are labeled as red, and they are driven by the applied electric field in the buffer solution (blue) to migrate across the nanofilter array. (b) The Delrin gadget contains pre-drilled holes as buffer reservoirs that connect to the buffer access holes in the ANA device, and the gadget also includes a silicone rubber for sealing the ANA device. The Delrin gadget is connected to the external power supply through a custom-designed PCB and is mounted on the inverted epi-fluorescence microscope (c–d). e–f show composite fluorescent photographs of separation of proteins (e) and DNA molecules (f) through the ANA under different electric field conditions. Band assignments: (e, left, Ex=75 V/cm and Ey= 50 V/cm) (1) Alexa Fluor 488-conjugated cholera toxin subunit B (MW~11.4 kDa); (2) Alexa Fluor 488-conjugated β-galactosidase (MW~116.3 kDa); (e, right, Ex=250 V/cm and Ey= 40 V/cm) (1) R-phycoerythrin (MW~240 kDa); (2) FITC dye molecule (MW~389 Da); (f, λ DNA–Hind III digest) (1) 2,322 bp, (2) 4,361 bp, (3) 6,557 bp, (4) 9,416 bp, (5) 23,130 bp. f–i: Ex=15 V/cm and Ey=25 V/cm. f–ii: Ex=50 V/cm and Ey=25 V/cm. f–iii: Ex=185 V/cm and Ey=100 V/cm. The fluorescence intensity profile shown in f–iii is measured at the ANA bottom edge. The bars underneath the peaks are centered at the means and label the stream widths. Part of e is reprinted by permission from the Royal Society of Chemistry: Lab on a Chip, copyright (2009). Part of f is reprinted by permission from Macmillan Publishers Ltd: Nature Nanotechnology, copyright (2007).

