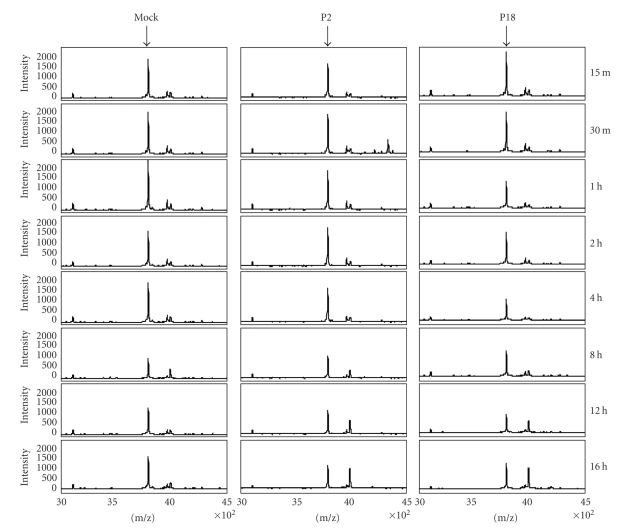
Figure 2.
Differential intensity of prothymosin-α peak. SELDI mass spectrometry analysis of triplicate cytoplasmic extracts from mock-, P2-, or P18 PICV-infected P388D1 cells over a time course of infection shows differential intensity of a protein peak (indicated by the arrows) at m/z approximately 3790 (Q = 0.0164). This peak was identified as prothymosin-α by tandem mass spectrometry. The figure shows one representative set of spectra from three independent experiments.

