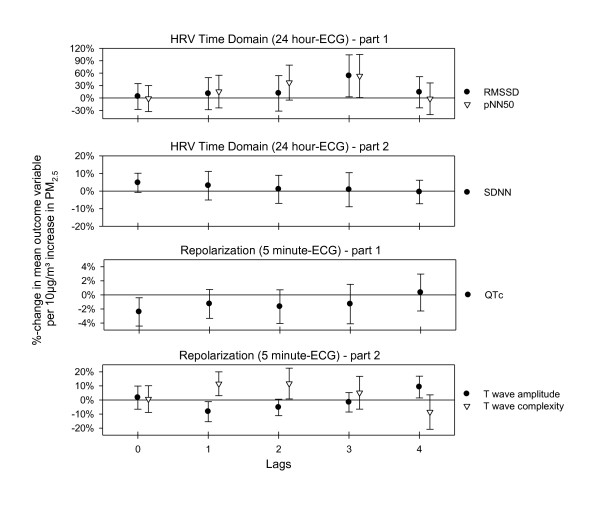
Figure 3.
Effect estimates for ECG-data with 95%-confidence intervals for immediate and delayed associations with PM2.5. All estimates are shown for individuals without beta-blocker intake. For T wave amplitude one individual was excluded due to very strong associations at lag 0. For 24 hour-ECGs lag 0 means the association between the 24 hour air pollution average concurrent to the ECG measurement.

