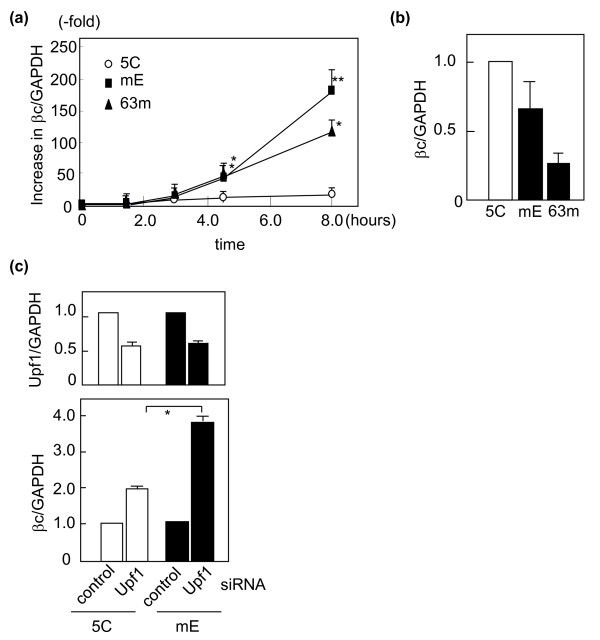
Figure 4.
Time course of βc transcript levels in response to puromycin. (a) Two βc79 clones, mE and 63m, and a wild-type βc clone 5C were incubated with 100 μg/mL puromycin for the indicated periods, and the ratios of βc-specific transcripts to endogenous GAPDH transcripts were measured by real-time RT-PCR with 1S/1A primers. The values at 0 hours are plotted as 1.0. The average values ± S.E.M. (error bars) were obtained from 3 to 8 experiments. * and **: significantly higher than the value in 5C incubated for the same time with p < 0.05 and p < 0.01, respectively. (b) After 8-hour treatment, the βc-specific transcripts were quantified and normalized by those of GAPDH. The values from mE and 63m cells were compared with those from 5C cells, which are plotted as 1.0. (c) The siRNA targeting Upf1 was introduced into 5C and mE cells, and the amounts of Upf1 and βc transcripts were quantified after 48 hours. The presented data are the average values and S. E. M. (error bars) f3rom four different experiments. *: significantly different (p < 0.05).

