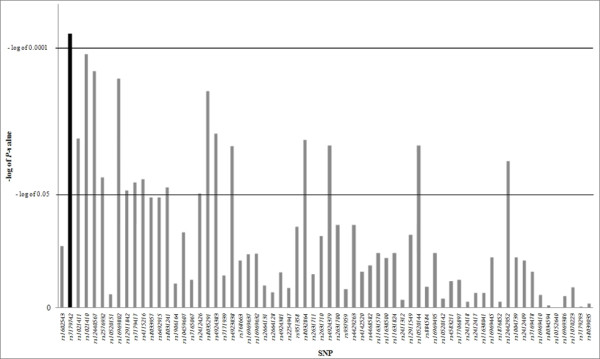
Figure 2.

A graph of negative log of P-values of SNPs. After correction for multiple testing, all SNPs are calculated for the better representation of the values. The log = 0.0001 equals to P = 0.05. SNP rs7179742, which is the only SNP to have significant P-value after the multiple corrections, is highlighted in black.
