Figure 1.
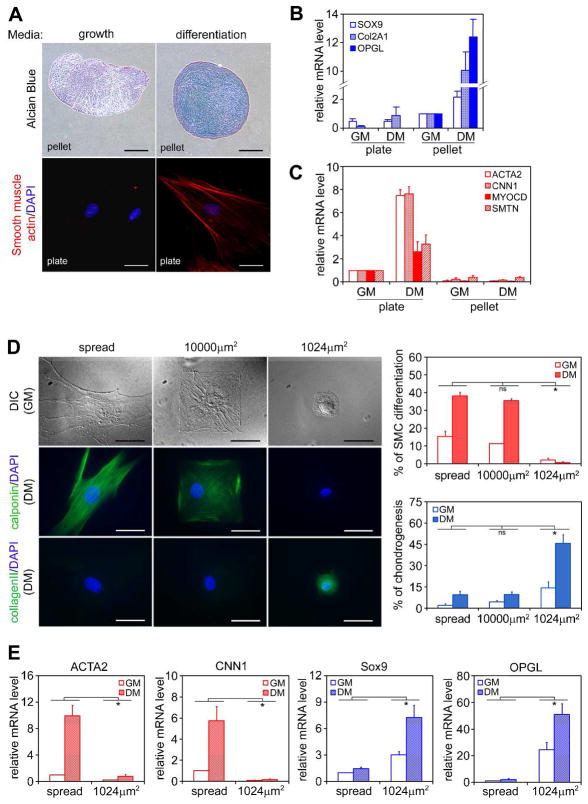
Cell shape regulates hMSC differentiation into smooth muscle cells (SMCs) vs. chondrocytes. (A) hMSCs were grown on tissue culture plates (3,000 cells/cm2) or as micromass pellets in growth medium (GM) or differentiation medium (DM) for 7 days. Cells on plates were fixed and stained for α-smooth muscle actin (red) and DAPI (blue). Cell pellets were fixed, embedded in paraffin, sectioned and stained with Alcian Blue. Upper panels: bar =300μm; lower panels: bar =50μm. (B) Real-time PCR analysis of chondrogenic gene expression of hMSCs grown under different culture conditions for 7 days (data are represented as mean±SEM; n=3). SOX9: SRY-box 9; COL2A1: collagen II; OPGL: osteoprotegerin ligand. Although osteoprotegerin ligand (OPGL) is not commonly used as a chondrogenic marker, we found this gene was specifically and robustly upregulated only during hMSC chondrogenesis (Figure S1). (C) Real-time PCR analysis of SMC gene expression of hMSCs grown under different culture conditions for 1 day (data are represented as mean±SEM; n=3). ACTA2: α-smooth muscle actin; CNN1: calponin 1; MYOCD: myocardin; SMTN: smoothelin. (D) hMSCs were grown on either unpatterned fibronectin-coated PDMS substrate, or PDMS substrates patterned with large (10,000μm2) or small (1024μm2) fibronectin islands in GM or DM for 7 days. Cells were fixed, stained for calponin or collagen II (green) and DAPI (blue), and counted (data are represented as mean±SEM; n=3). Bar=50μm. (E) Real-time PCR analysis of SMC and chondrogenic gene expression of hMSCs grown on either flat substrate or 1024μm2 islands after 1 day (data are represented as mean±SEM; n=6). * (P<0.05) and ns (not significant), as calculated by 2-way ANOVA and Tukey’s HSD test.

