Figure 3.

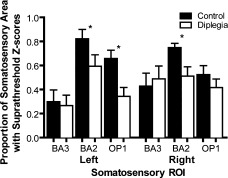
Area proportion indices (API) for activity evoked during the TSD task in selected primary (BA3 and BA2) and secondary (OP1) somatosensory regions. Bars show means and SEM. Asterisk marks ROI with significant group differences in API.

Area proportion indices (API) for activity evoked during the TSD task in selected primary (BA3 and BA2) and secondary (OP1) somatosensory regions. Bars show means and SEM. Asterisk marks ROI with significant group differences in API.