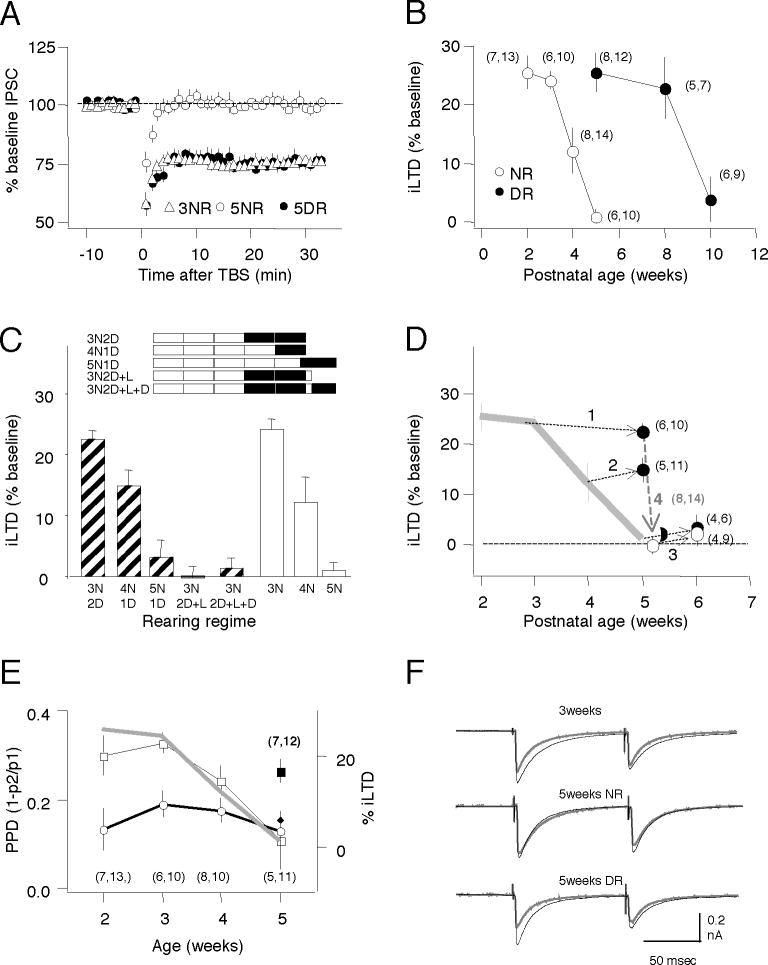
Figure 2. Induction of iLTD during a critical period regulated by visual experience.
A) Response to TBS on IPSC amplitudes recorded in pyramidal cells from normal-reared 3 week olds (open diamonds), normal-reared 5 weeks olds (open circles) or dark-reared 5 week olds (filled circles). B) Developmental changes in iLTD magnitude in normal-reared (open circles) and dark-reared rats (filled circles). C) Dark rearing arrests the developmental loss of iLTD. Similar amplitude of iLTD is induced in normal-reared 3 week olds (3N), and in 5 week olds placed in the dark when 3 weeks old(3N2D), or in normal reared 4 week olds (4N), and 5 week olds placed in the dark when 4 weeks old (4N1D). Minimal iLTD induced in normal–reared five week old rats that were exposed to light for 2 days after two weeks of dark-rearing (3N2D+L), or in rats that were reintroduced to the dark for a second duration of dark rearing for 4 – 6 days (3N2D+L+D). D) Same data as in C), expressed as iLTD amplitude versus age. The arrows join the value of iLTD predicted by the duration of light-rearing with the value of iLTD observed following dark rearing for 3N2D (line1), 4N1D (line2), 5N1D (line3), and 3N2D+L (line4). The grey line indicates the changes in iLTD in normal-reared rats (replotted from B). E) Average paired-pulse depression (PPD) before (squares) and 30 min after TBS (circles) (left axis) and changes in iLTD magnitude (grey line; right axis) versus age. Normal-reared animals (open symbols), 5 week-old rats reared in dark from birth (closed symbols). F) Examples traces: averages of 10 consecutive responses (normalized to the first response) recorded before (black) and 30 min after TBS (grey). In parentheses in B,C,E is the number of rats and cells. See also Figure S2.

