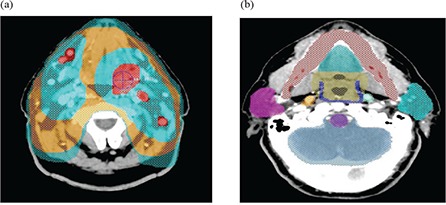
Figure 1.

An illustration of the (a) planning target volumes: PTV1 (blue‐green), PTV2 (orange), and PTV3 (two light blue‐green sections at top) in the transverse slice, and (b) normal structures delineated using the treatment planning system such as mandible (red), oral cavity (blue‐green top), oropharynx (taupe), superior pharyngeal constrictor (blue), left parotid (blue‐green right), brainstem (purple), brain (blue‐gray), and right parotid (violet).
