Figure 2.

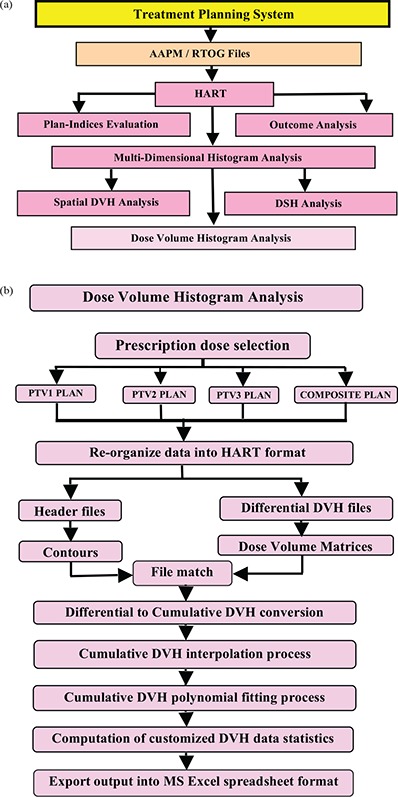
Flow chart demonstrates (a) the multiple feature selection process, and (b) the computational steps for dose‐volume histogram analysis module in HART.

Flow chart demonstrates (a) the multiple feature selection process, and (b) the computational steps for dose‐volume histogram analysis module in HART.