Figure 5.

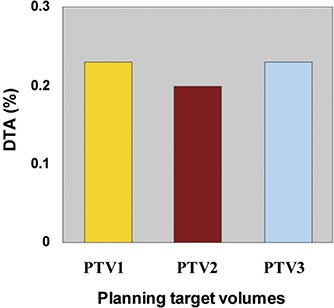
Distance to agreement (DTA) analyses for planning target volume (PTV1, PTV2, and PTV3) dose‐volume histogram data points in regions of high dose gradients. DTA is normalized relative to the prescription doses of individual plans.

Distance to agreement (DTA) analyses for planning target volume (PTV1, PTV2, and PTV3) dose‐volume histogram data points in regions of high dose gradients. DTA is normalized relative to the prescription doses of individual plans.