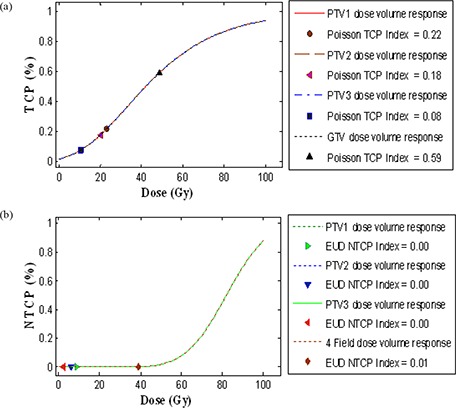
Figure 7.

Plan specific outcome analysis (POA) of three IMRT plans and a standard four field box treatment technique for a PELVIS plan designed for a typical prostate cancer patient at T4‐stage. (a) Local tumor control probability (TCP) for planning target volumes PTV1 (prescription dose (PD) of 1260 cGy), PTV2 (PD of 1040 cGy), PTV3 (PD of 510 cGy), and for GTV (PD of 4500 cGy) with the significant control parameters reported at 95% confidence intervals: , and in Poisson model is displayed on top simulation, and (b) normal tissue complication probability (NTCP) for rectum with the significant control parameters reported at 95% confidence intervals: , , in Lyman‐EUD model is displayed on the bottom simulation. TCP and NTCP indices represent the corresponding probabilities of the individual treatment plans as mentioned in legend.
