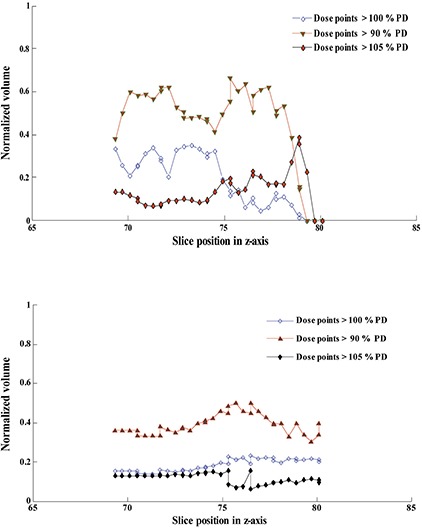
Figure 8.

A simpler demonstration of a spatial dose‐volume histogram (zDVH) analysis (top) in a specific computed tomography (CT) slice, and a dose‐surface histogram (DSH) analysis (bottom) of a typical organ contoured in a treatment plan designed for a head and neck cancer patient. The extraction of differential dose‐volume histogram (dDVH) raw data, along with zDVH and DSH computations and simulations for 15‐20 organs contoured in a treatment plan were efficiently accomplished in 15‐20 minutes in HART.
