Figure 3.

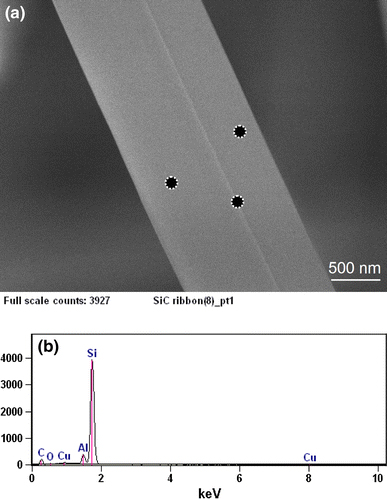
a SEM image of a nanoribbon segment with EDX signal collection spots marked; b EDX spectrum obtained from left side region of the nanoribbon

a SEM image of a nanoribbon segment with EDX signal collection spots marked; b EDX spectrum obtained from left side region of the nanoribbon