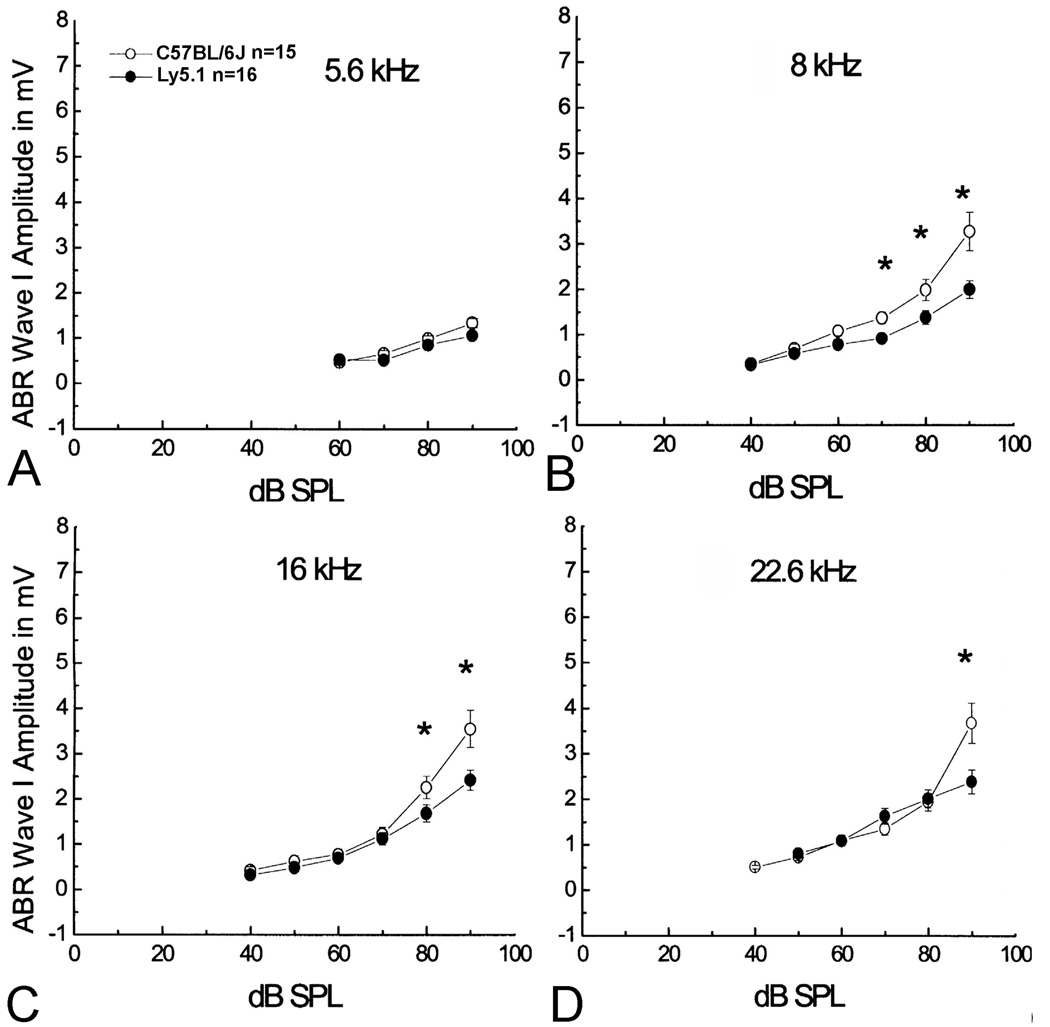
Figure 10. Mean wave I amplitudes vs. level functions.
Decreased wave I amplitude at 8 (B), 16 (C) and 22.6 (D) kHz with high levels of stimuli compared to C57BL/6J mice. Note that no significant decrease was seen between Ly5.1 and C57BL/6J mice in wave I amplitude at 5.6 kHz (A). The flattened curves of wave I amplitude I/O functions suggest a functional decline of SGNs which may correlate to the lower density of neurons in the basal cochlea of Ly5.1 mice (Fig. 3). Data were collected from the mice shown in Figs. 8 and 9. Data presented as mean ± standard error of the mean (SEM). Asterisks indicate a statistically significant difference at the indicated frequency (ANOVA, p<0.01).

