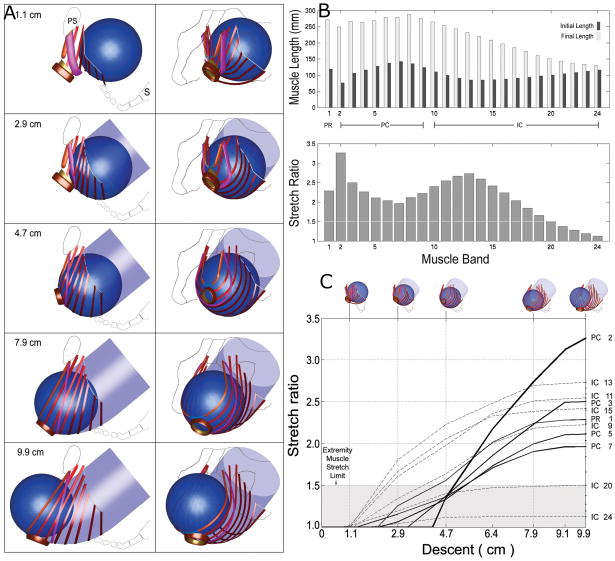
Figure 3.
(a) Simulated effect of fetal head descent on the levator ani muscles in the second stage of labor. At top left, a left lateral view shows the fetal head (as a sphere) located posteriorly and inferiorly to the pubic symphysis (PS) in front of the sacrum (S). The sequence of five images at left shows the fetal head as it descends 1.1, 2.9, 4.7, 7.9, and 9.9 cm below the ischial spines while the head passes along the curve of Carus (indicated by the transparent, light blue, curved tube). The sequence of five images at right are front-left, three-quarter views corresponding to those shown at left. (b) The upper bar graph compares, by muscle, initial and final muscle lengths corresponding to 1.1 and 9.9 cm model fetal head descent, respectively. The lower bar graph shows the maximum corresponding stretch ratio found in each levator ani muscle band. Note that the value of the stretch ratio is not simply proportional to initial or final length. For both graphs, muscles are arranged left to right, in ventral to dorsal order of origin location. (c) The relationship between fetal head descent (abscissa, icons at top) and the resulting muscle stretch ratios (ordinate) in selected levator ani muscles. The labels at right identify the pubovisceral (PC), iliococcygeus (IC), and puborectalis (PR) muscle bands. The largest stretch is induced in the medial-most pubovisceral (PC2) muscle, the last muscle to be engaged by the fetal head. The shaded region denotes the values of stretch tolerated by nongravid appendicular striated muscle without injury. From Reference 10.
© Biomechanics Research Lab, University of Michigan, Ann Arbor 2003.

