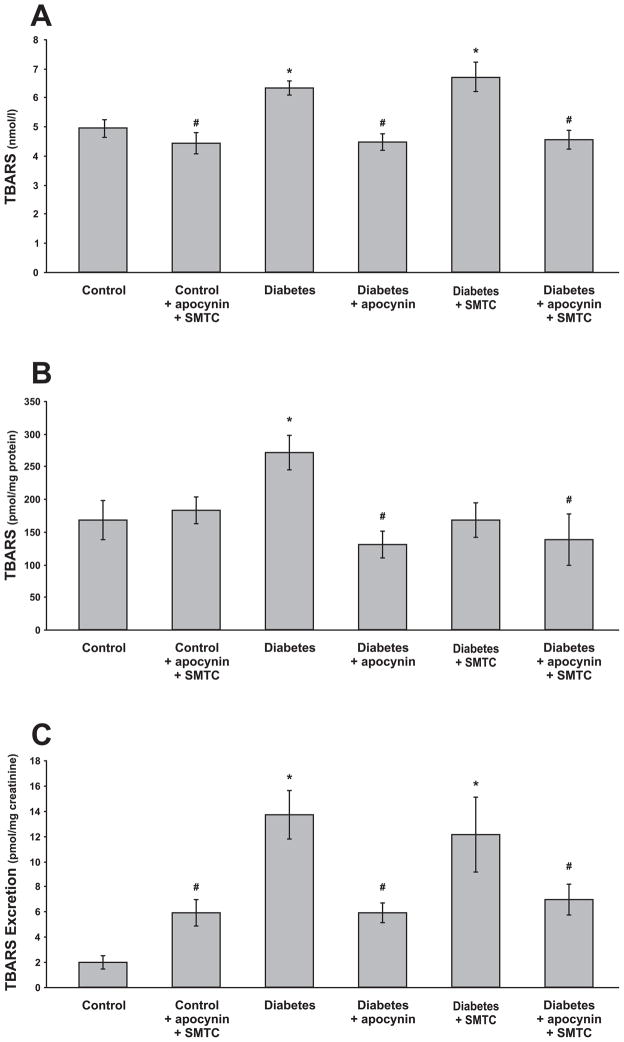
Figure 3.
Lipid peroxidation, estimated as TBARS, in plasma (A), kidney cortex (B) and 24h urinary TBARS excretion (C) in normoglycemic controls and diabetic rats with and without the different chronic treatments. * denotes P<0.05 vs. untreated control group and # denotes P<0.05 vs. untreated diabetic group. All values are means ± SEM.

