Figure 2.
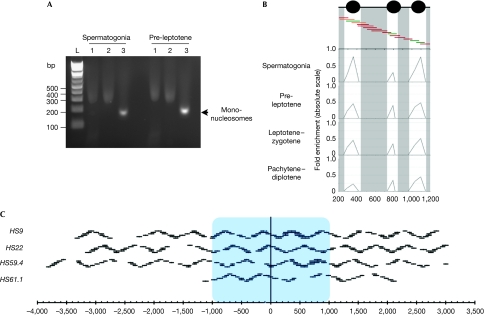
Schematic of the nucleosome mapping technique. (A) Typical mono-nucleosome preparation from the indicated FACS-purified meiotic cells is shown. Lanes 1 correspond to the total chromatin fraction after MNAse digestion, lanes 2 indicate the extracted nucleosomes after native chromatin treatment and lanes 3 show the purified mono-nucleosomes after desalting. The high salt concentration causes aberrant migration in lanes 1 and 2. (B) FACS-purified meiotic fractions are digested to completion with MNase, DNA is purified and mono-nucleosome fragments are isolated. Mono-nucleosomal DNA is used as a template for quantitative PCR with overlapping primer pairs. A small 1 kb region is shown at the HS9 locus. Protection of DNA from MNase digestion by nucleosomes will result in a robust PCR signal (green primer pairs), partial protection in an intermediate PCR signal (orange) and no protection in a trace PCR signal (dark red). Profiles are shown at the four studied stages as indicated. (C) Diagram representing all the primer pairs used for the four studied hotspots. The blue box indicates the approximate recombinogenic core. Gaps in the oligonucleotide pairs were owing to simple repeats, poor efficiency or primer pair failure to yield unique products. FACS, fluorescence-activated cell sorting; MNase, micrococcal nuclease.

