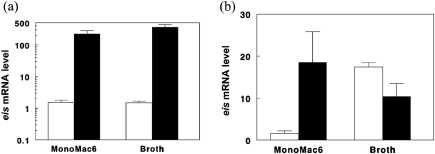
Fig. 2.
Expression patterns of eis in recombinant and wild-type TB294. M. tuberculosis strains were cultured in MonoMac6 cells for 6 days, or in broth to OD600 0.6–0.8. RNA was extracted and eis expression was examined by real-time PCR. The ratio of eis mRNA to 16S rRNA was calculated for each sample and is shown as eis mRNA levels. Because amounts of eis mRNA were low in comparison to 16S rRNA, ratios were multiplied by 1000 to give values ≥1. Mean values and standard errors for three experiments are shown. (a) Comparison of eis expression in TB294-pSigA and TB294-pCV. White bars, TB294-pCV; black bars, TB294-pSigA. (b) Comparison of eis expression in wild-type TB294 and H37Rv. White bars, H37Rv; black bars, TB294.

