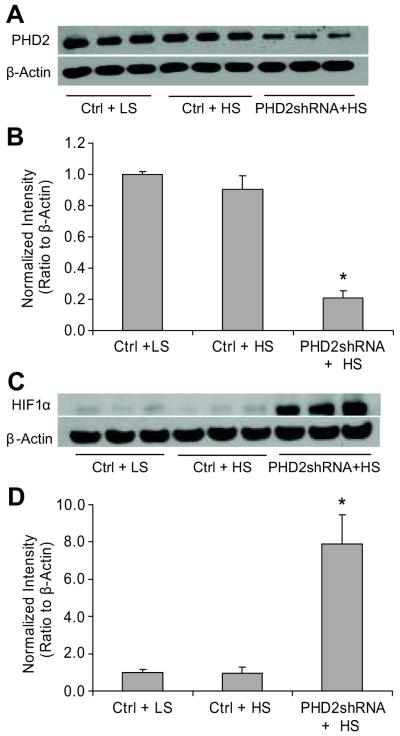
Figure 6. Effect of PHD2 gene silencing on high salt-induced changes in HIF-1α levels in the renal medulla from Dahl S rats.
A: Representative ECL gel documents of Western blot analyses depicting the protein levels of PHD2. B: Summarized intensities of the PHD2 blots normalized to β-actin. C and D: Gel documents and summarized intensities of the HIF-1α blots normalized to β-actin. * P < 0.05 vs. others (n=6). Ctrl = vectors expressing scrambled shRNA, PHD2shRNA = vectors expressing PHD2 specific shRNA.

