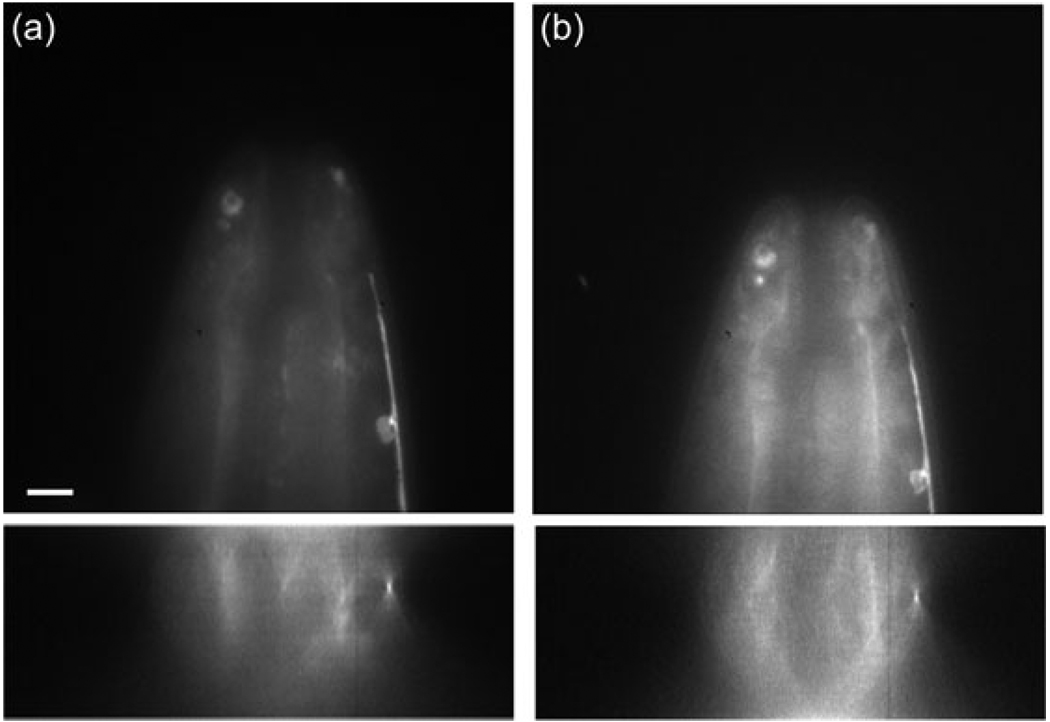
Fig. 11.
Comparison of images taken by focusing with the DM (a) and mechanical focusing (b). Images are of C. elegans expressing a GFP sur-5 construct; the bright feature along the right side is the ventral nerve cord. The top images are taken 6 µm below the cover slip and the bottom images are xz-cross-sections. The difference in image intensity is due to photobleaching. Each image is scaled to its maximum intensity. A sample refractive index of 1.36 was assumed for focusing with the DM using Eq. (2). The scale bar is 2 µm.

