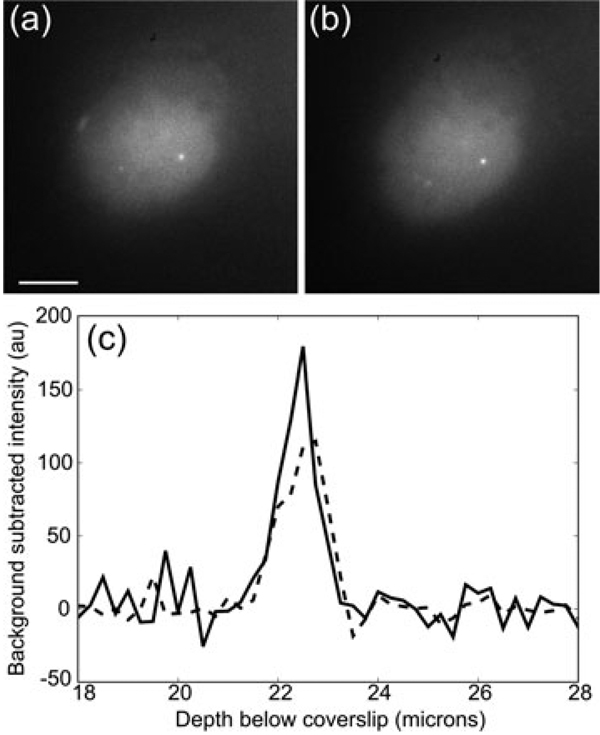
Fig. 7.
Images of GFP-TRF1 labelled telomeres in UMUC bladder cancer cells. (a) Uncorrected images 23 µm below the cover slip. (b) Depth aberration corrected 23 µm below the cover slip. The correction assumed a sample index of 1.38 (c) Background subtracted profiles through the labelled telomere (bright spot in images a and b) along the axial direction. The dashed line is from the uncorrected image a, and the solid line is from the corrected image (b). The peak intensity in the corrected image is 60% larger over the background. The scale bar is 5 µm.

