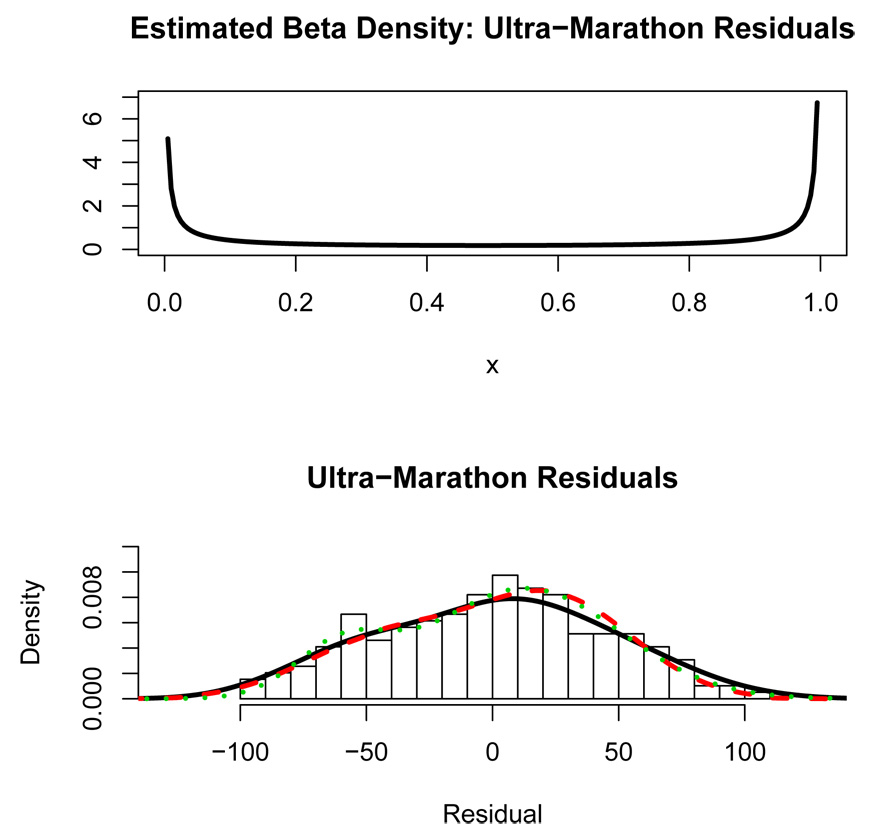
Figure 9.
Top panel: Latent beta density for the ultra-marathon residuals at the point the algorithm stopped. Bottom panel: Histogram of ultra-marathon residuals from fitting the finishing time on age and sex. The solid curve is a nonparametric density estimate. The dashed curve is the latent regression fit to the residuals and the dotted curve is the 2-component normal mixture fit.

