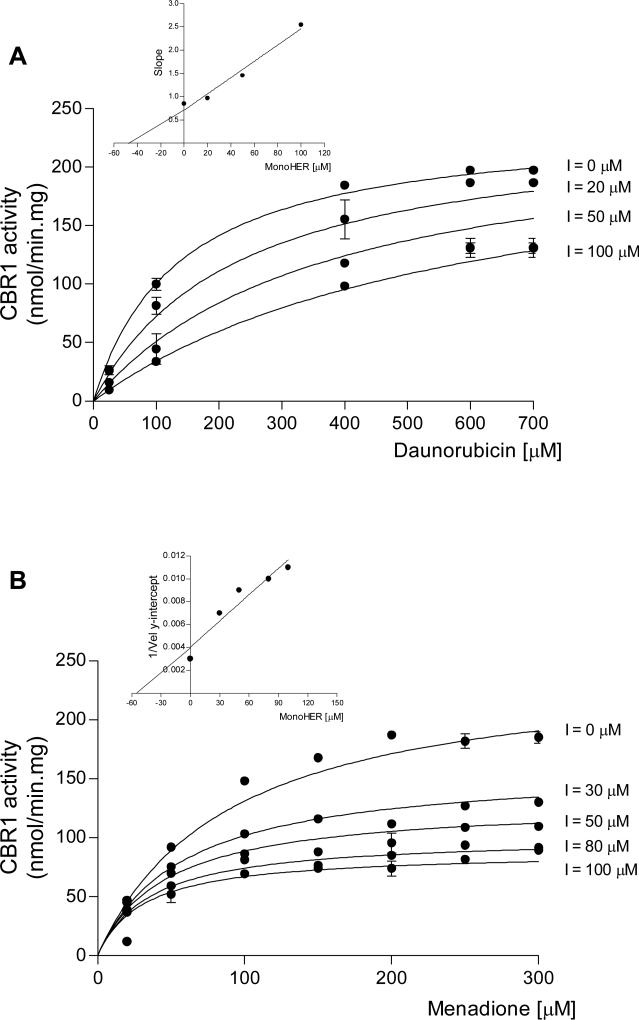
FIGURE 3.
Kinetic analysis of CBR1 inhibition by increasing concentrations of monoHER in the presence of the substrates daunorubicin (panel A), and menadione (panel B). Each point represents the mean ± S.D. of two experiments performed in duplicate with two independent protein preparations. Insets: graphical determination of Ki values. Replot of the slopes from double-reciprocal plots (panel A; r2>0.90), and replot of the 1/velocity y-intercepts from double reciprocal plots (panel B; r2>0.90). Similar Ki values were obtained from non-linear regression analyses (see text).

