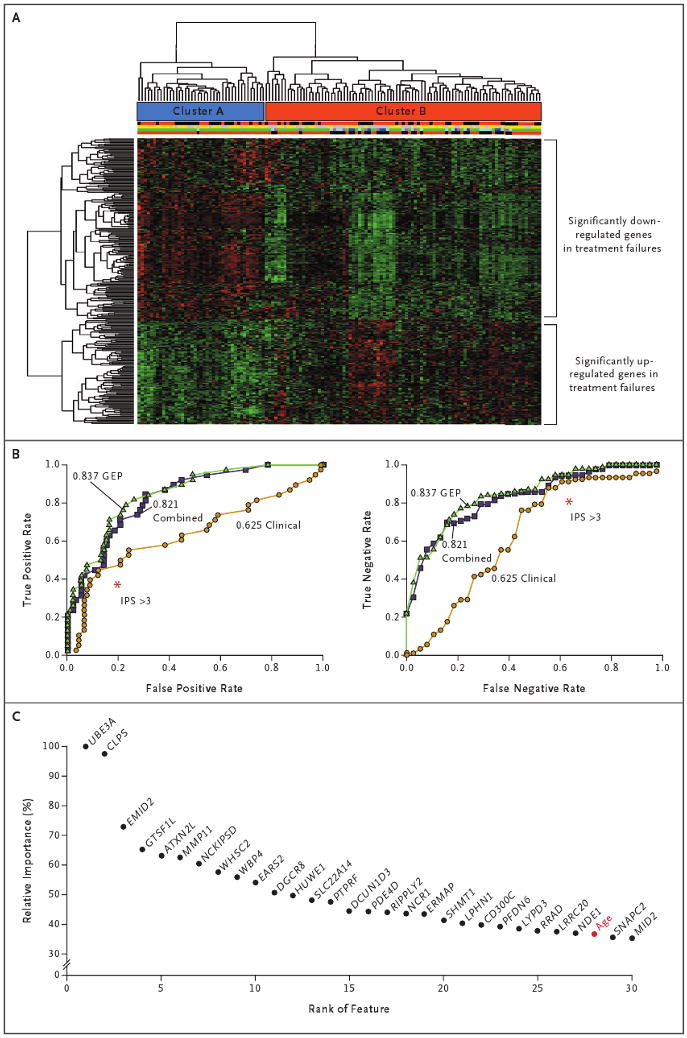
Figure 1. Hierarchical Clustering of Gene-Expression Profiles in Hodgkin's Lymphoma, True and False Positive and Negative Rates for Three Models of Outcome Prediction, and the Importance of Individual Genes for Outcome Prediction.

Panel A shows hierarchical clustering of 130 gene-expression profiles for patients with classic Hodgkin's lymphoma. Cluster A has been enriched with primary treatment successes, and Cluster B with both primary treatment successes and failures. Immediately below the cluster bars, the first multicolored bar indicates sex (red for male and black for female), the second bar indicates stage (yellow for limited disease and gray for advanced disease), the third bar indicates the type of treatment failure (green for no treatment failure, purple for refractory, dark blue for early relapse, and light blue for late relapse), and the fourth bar indicates the primary treatment outcome (black for failure and red for success). (For details, see Tables S2 and S3 in the Supplementary Appendix, available with the full text of this article at NEJM.org.) Panel B shows plots of true positive and false positive rates and true negative and false negative rates (receiver-operating-characteristic curves) for three models that were used for feature selection: gene-expression profiling (GEP), a model based on the International Prognostic Score (IPS) for clinical variables, and a model combining these two features. This comparison showed that the value for the area under the curve was highest for the GEP model, as compared with the clinical and combined models (0.837 vs. 0.625 and 0.821, respectively). For comparison with the established IPS, red asterisks indicate an IPS of more than 3, as calculated with the use of IPS thresholds.4 Panel C shows the relative importance of individual genes for outcome prediction. Relative importance is shown for 30 annotated probe sets (selected with the use of sparse multinomial logistic regression) that were more influential than Ann Arbor staging. Among the 27 individual genes exceeding the importance of the best clinical variable, age (shown in red), was MMP11.
