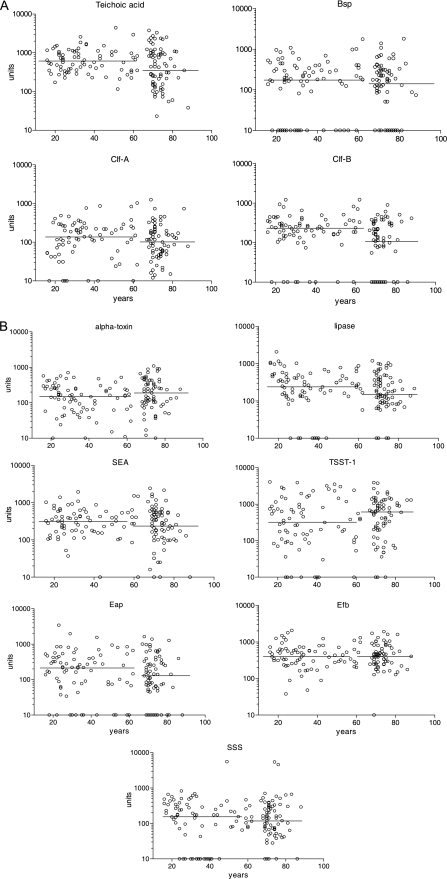
FIG. 1.
Serum IgG levels against different antigens. (A) Surface antigens. (B) Extracellular proteins. Each graphic shows the levels expressed in units, as described in Materials and Methods. The circles on the x axis indicate individuals lacking measurable levels of antibodies to the respective antigen; the horizontal lines crossing the dots show the median values for individuals younger and older than 65 years of age. Great variability against different antigens at all ages can be observed.

