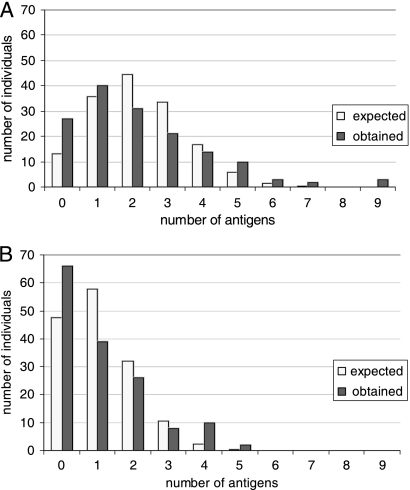
FIG. 2.
Distribution of observed versus expected numbers of individuals showing low or high levels of antibodies against one or more antigens. The x axis shows the number of antigens, and the y axis indicates the number of individuals who showed low or high levels of antibodies against this number of antigens. The observed and expected numbers of individuals were calculated based upon the random probability according to the binomial distribution. (A) Low levels, defined as levels below the 20th percentile for each antigen. (B) High levels, defined as levels above the 90th percentile for each antigen. The expected numbers were calculated using 20% and 10% random possibility, respectively, considering 11 different antigens.

