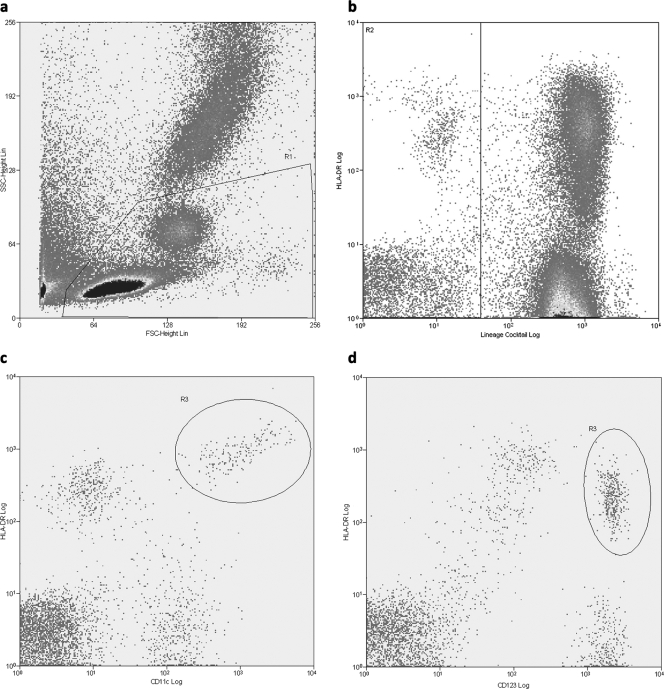
FIG. 1.
Representative phenotypic analysis of mDC and pDC subsets by flow cytometry. (a) PBMCs were gated according to their forward (FSC) and side (SSC) scatter characteristics (R1). (b) Lin-negative but HLA-DR-positive cells were gated on region R2. (c and d) Gates R1 and R2 were selected, and mDCs were identified as Lin negative, HLA-DR and CD11c-positive (R3) (c), while pDCs were identified as Lin negative, HLA-DR and CD123 positive (R3) (d).

