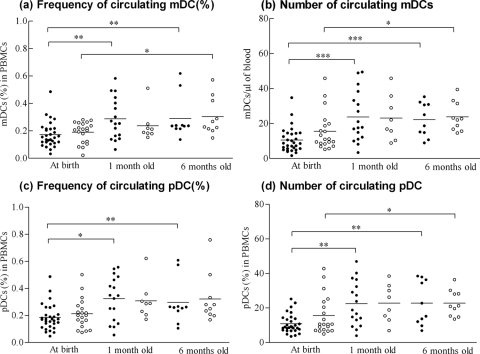
FIG. 2.
The frequencies and absolute numbers of myeloid DCs (a and b) and plasmacytoid DCs (c and d) from subject (•) and control (○) neonates in different age groups plotted from the data from the cytometric analysis. Each dot represents a single donor, and the horizontal bars represent the means. There were no significant differences between children from chronically HBV-infected mothers and controls in all age groups. mDC and pDC frequencies and numbers were significantly lower at birth than for 1- and 6-month-old neonates, independent of maternal HBV status. *, P < 0.05 between groups; **, P < 0.005 between groups; ***, P < 0.0005 between groups.

