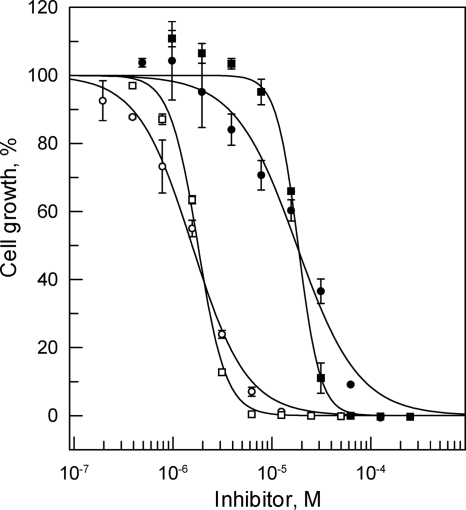
FIG. 5.
Cross-resistance to nifurtimox in FxR cell lines. EC50s were determined for fexinidazole (circles) and nifurtimox (squares) against WT (open symbols) and FxR1 (closed symbols) cells, respectively. The curves are the nonlinear fits of data using a two-parameter EC50 equation provided by GraFit (see Materials and Methods). In this experiment, the EC50 (and Hill slope) values for fexinidazole are 1.6 ± 0.1 μM (1.6) and 17.8 ± 1.5 μM (1.4) for WT and FxR1 cells, respectively, and for nifurtimox are 1.8 ± 0.1 μM (3.1) and 18.4 ± 0.6 μM (3.9), respectively.

