
FIG. 1.
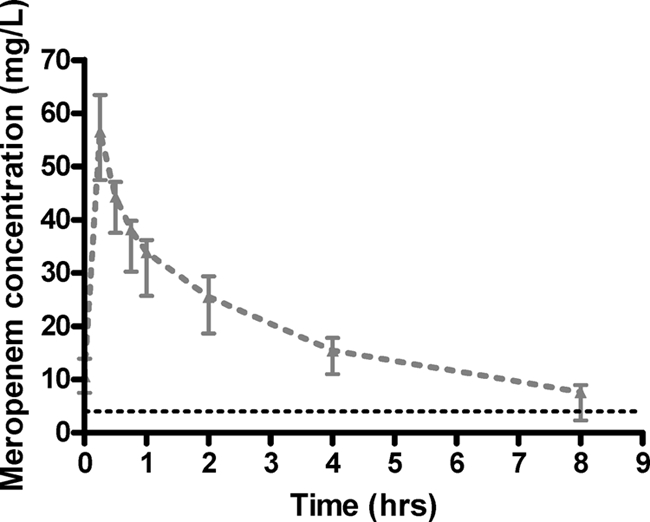
Median (and interquartile) concentration-versus-time data for the enrolled patients. The black broken line represents the MIC for B. pseudomallei (4 mg/liter).
Official websites use .gov
A
.gov website belongs to an official
government organization in the United States.
Secure .gov websites use HTTPS
A lock (
) or https:// means you've safely
connected to the .gov website. Share sensitive
information only on official, secure websites.
Median (and interquartile) concentration-versus-time data for the enrolled patients. The black broken line represents the MIC for B. pseudomallei (4 mg/liter).