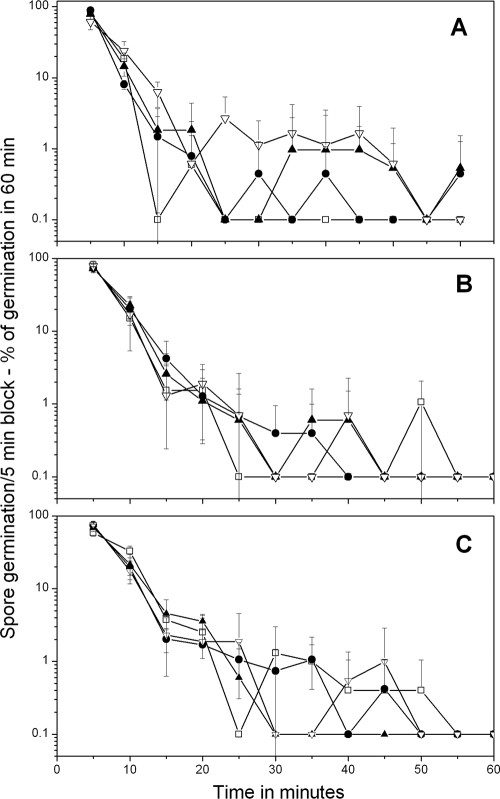
FIG. 1.
Germination of B. megaterium spores with various concentrations of d-glucose (A), l-proline (B), and KBr (C) analyzed by method A. Heat-activated B. megaterium spores were germinated, and the percentage of spores germinating in various time periods and the standard deviations of these values were determined by method A as described in Materials and Methods. The symbols used (and the percentage of spores that germinated in 90 min and total number of spores analyzed) are as follows: panel A, □, 10 mM d-glucose (89% of 226 spores), •, 100 μM d-glucose (74% of 397 spores), ▴, 50 μM d-glucose (52% of 449 spores), and ▿, 15 μM d-glucose (19% of 1,018 spores); panel B, □, 5 mM l-proline (82% of 253 spores), •, 1 mM l-proline (66% of 517 spores), ▴, 500 μM l-proline (58% of 347 spores), and ▿, 150 μM l-proline (29% of 588 spores); panel C, □, 50 mM KBr (71% of 477 spores), •, 5 mM KBr (64% of 492 spores), ▴, 1 mM KBr (54% of 374 spores), and ▿, 100 μM KBr (25% of 900 spores). In the absence of d-glucose, l-proline, or KBr there was ≤2% germination of these spores in 90 min. Note that all values plotted as 0.1% germination are actually 0%, but were plotted as 0.1% to allow use of a log scale to display the low levels of spores that germinated slowly, in particular at intermediate times. Note also that (i) the values given on the vertical axis are the percentage of spores that germinated in a particular 5-min period in the experiment and (ii) the latter values have been normalized to the total number of spores that germinated in the complete experimental period to allow better comparison of experiments in which high and low percentages of spores germinated.

