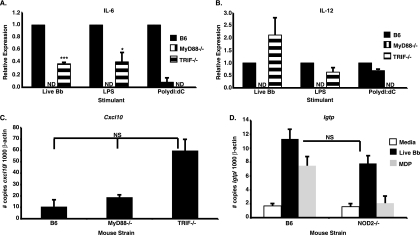
FIG. 1.
B. burgdorferi induction of IFN-responsive genes is independent of TRIF and NOD2. (A and B) Wild-type B6, MyD88−/−, or TRIF−/− BMDMs were stimulated with 7.4 × 10⁶/ml live B. burgdorferi organisms (Bb), 100 ng/ml LPS, or 20 μg/ml poly(dI:dC) for 6 h. ND, not detected. The production of IL-6 (A) or IL-12 (B) was assessed by ELISA. Data indicate the means ± standard errors of the means (SEM) and are pooled from two independent experiments (n = 4). Statistical significance was assessed via a paired, two-tailed Student t test. ***, P < 0.001 for IL-6 levels obtained for TRIF−/− BMDMs stimulated with live B. burgdorferi versus comparably treated B6 BMDMs; *, P < 0.05 for LPS-treated TRIF−/− BMDMs versus similarly stimulated B6 BMDMs. In panel B, IL-12 levels for live B. burgdorferi (P = 0.1996)- or LPS (P = 0.1010)-stimulated TRIF−/− BMDMs were not significantly different from those for comparably treated B6 BMDMs. (C) Cellular RNA from B6, MyD88−/−, or TRIF−/− BMDMs was analyzed by quantitative RT-PCR for IFN-responsive gene transcription at 6 h after B. burgdorferi stimulation. Data are depicted as the means ± SEM and are pooled from two independent experiments (n = 4). Statistical significance was assessed via an unpaired, two-tailed Student t test with the Welch correction. Transcript levels for Cxcl10 are depicted as the fold change induction obtained for each normalized transcript following B. burgdorferi stimulation (7.4 × 10⁶/ml) relative to values obtained for unstimulated cells. Although B. burgdorferi-induced IFN-responsive gene expression was elevated in TRIF−/− BMDMs, this increase was not statistically significant (NS) compared with values obtained for B6 (P = 0.0519) and MyD88−/− (P = 0.0777) BMDMs. (D) Cellular RNA from B6 or NOD2−/− BMDMs was analyzed by quantitative RT-PCR for IFN-responsive gene transcription at 24 h after B. burgdorferi stimulation. Data are depicted as the means ± SEM and are pooled from three independent experiments (n = 6). Statistical significance was assessed via the Mann-Whitney U test. Igtp transcript levels obtained from B. burgdorferi (7.4 × 10⁶/ml)- or MDP (10 ng/ml)-stimulated B6 or NOD2−/− BMDMs are displayed as the number of copies normalized to β-actin. The Igtp expression levels obtained for B6 and NOD2−/− BMDMs following B. burgdorferi stimulation were not significantly different (NS) (P = 0.1320).

