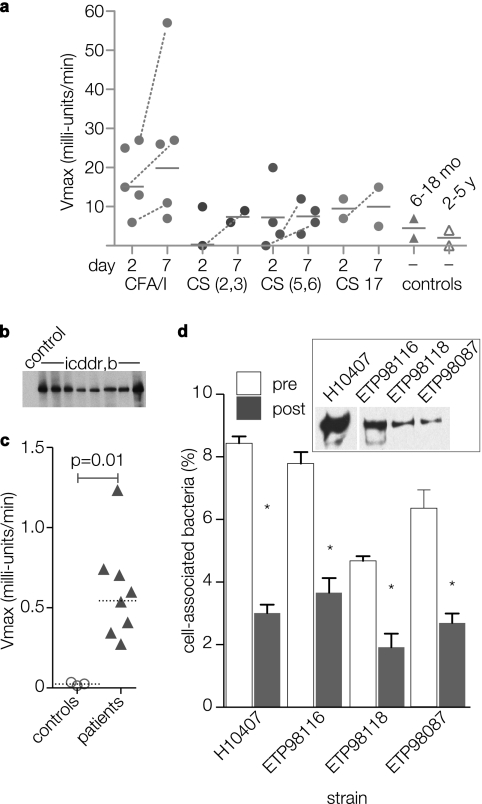
FIG. 4.
Human immune responses to EtpA. (a) Screening kinetic ELISA detection of anti-rEtpAgp (IgA) antibodies performed on early convalescent-phase sera (1:50 dilution) from Bangladeshi patients infected with ETEC. Each symbol represents a value for an individual patient obtained on either day 2 or 7 following initial hospitalization. Horizontal lines represent geometric mean values; dashed lines connect only patient sample values corresponding to demonstrable increases in value from day 2 to day 7 of hospitalization. The CF type for isolated strains is shown on the x axis (CS, coli surface antigen). The controls were age-matched children without ETEC infections (6- to 18-month-old children or 2- to 5-year-old children). The y axis shows absorbance readings at Vmax (in milliunits per minute). (b and c) Immunoblots and kinetic ELISA comparison of sera from patients in Dhaka, Bangladesh, and age-matched control sera from patients in the United States. Values represent total anti-EtpAgp antibody in day 7 samples (diluted 1:1,028) relative to controls. (d) Caco-2 cell in vitro adherence assays with EtpA-producing ETEC strains isolated from patients in Dhaka, Bangladesh (inset immunoblot shows EtpA produced by three isolates from ICDDR,B and ETEC H10407 positive-control strain). Data are shown for preimmune sera (pre) and anti-EtpA postimmune polyclonal antisera (post) (1:100 dilution). Bars represent means plus standard deviations (error bars) for four replicates. Values that were significantly different (P ≤ 0.05) for preimmune sera and postimmune antisera by Mann-Whitney analysis are indicated by an asterisk.

