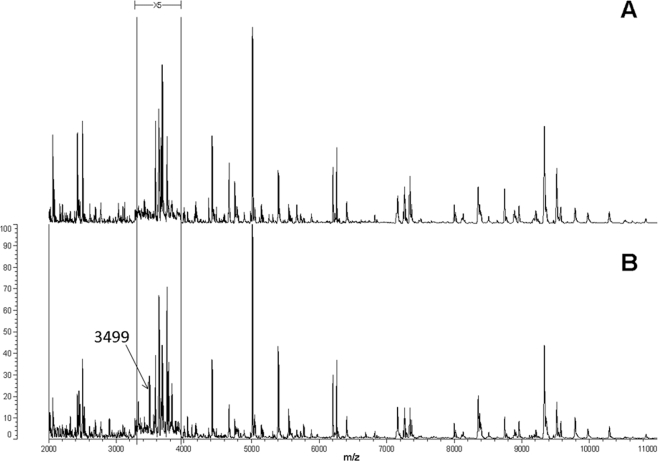
FIG. 6.
Comparison of MALDI-TOF MS protein mass fingerprints of pigmentless P. vagans variant C9-1W (A) lacking the 530-kb plasmid pPag3 and the related wild-type strain P. vagans C9-1 (B). The masses (in daltons) of the ions are shown on the x axis. The m/z values represent mass-to-charge ratios. Relative intensities of ions (percentages) on the y axis are 5-fold exaggerated between 3,300 and 3,950 Da to highlight the disappearance of the 3,499-Da mass signal in C9-1W. Other masses missing from the plasmidless variant C9-1W were at 2,133, 2,140, 2,309, 2,396, 3,197, 3,552, 3,570, 4,295, and 4,850 Da, but most of the signals have low intensities and cannot easily be visualized in the protein profile. Marker masses for the identification of P. vagans are listed in Fig. 4.

