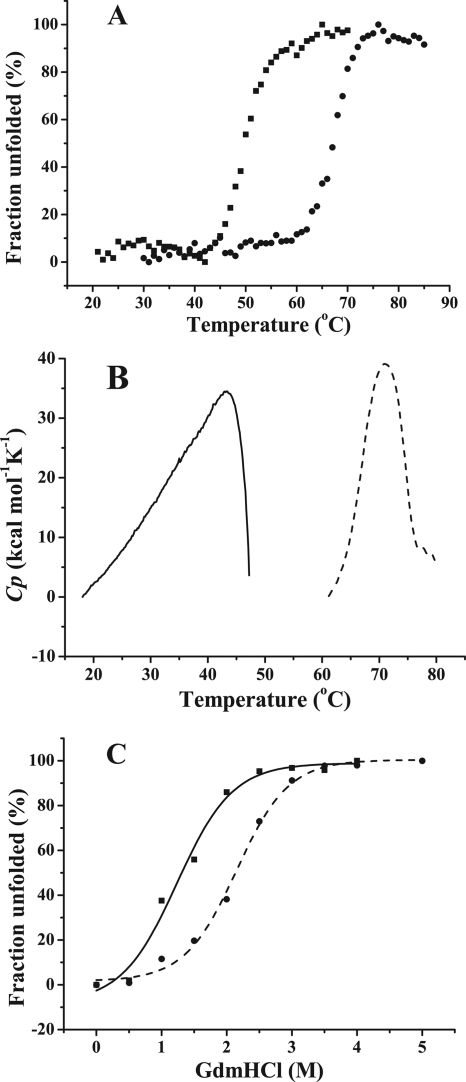
FIG. 4.
Thermal unfolding and GdmHCl unfolding of PsDppA and EcDppA. (A) Thermal unfolding curves of PsDppA (▪) and EcDppA (•) detected by CD. CD spectra of DppA proteins with the same concentration (3.3 to 3.4 μM) were collected from 260 to 190 nm. The ellipticity at 222 nm was recorded as the temperature increased from 25 to 85°C at a rate of 1°C/min. (B) Thermal unfolding curves of PsDppA (solid line) and EcDppA (broken line) detected by DSC at a scan rate of 60°C/h with a protein concentration of ∼1 mg/ml. (C) GdmHCl unfolding of PsDppA (▪, solid line) and EcDppA (•, dashed line) detected by CD. Native PsDppA and EcDppA (3.4 μM) were incubated at room temperature for 1 h with various concentrations of GdmHCl (0 to 5 M), and then the CD spectra were measured by recording the ellipticity at 222 nm. Experiments were all performed in 25 mM phosphate buffer at pH 7.5. All of the these experiments were repeated three times.

