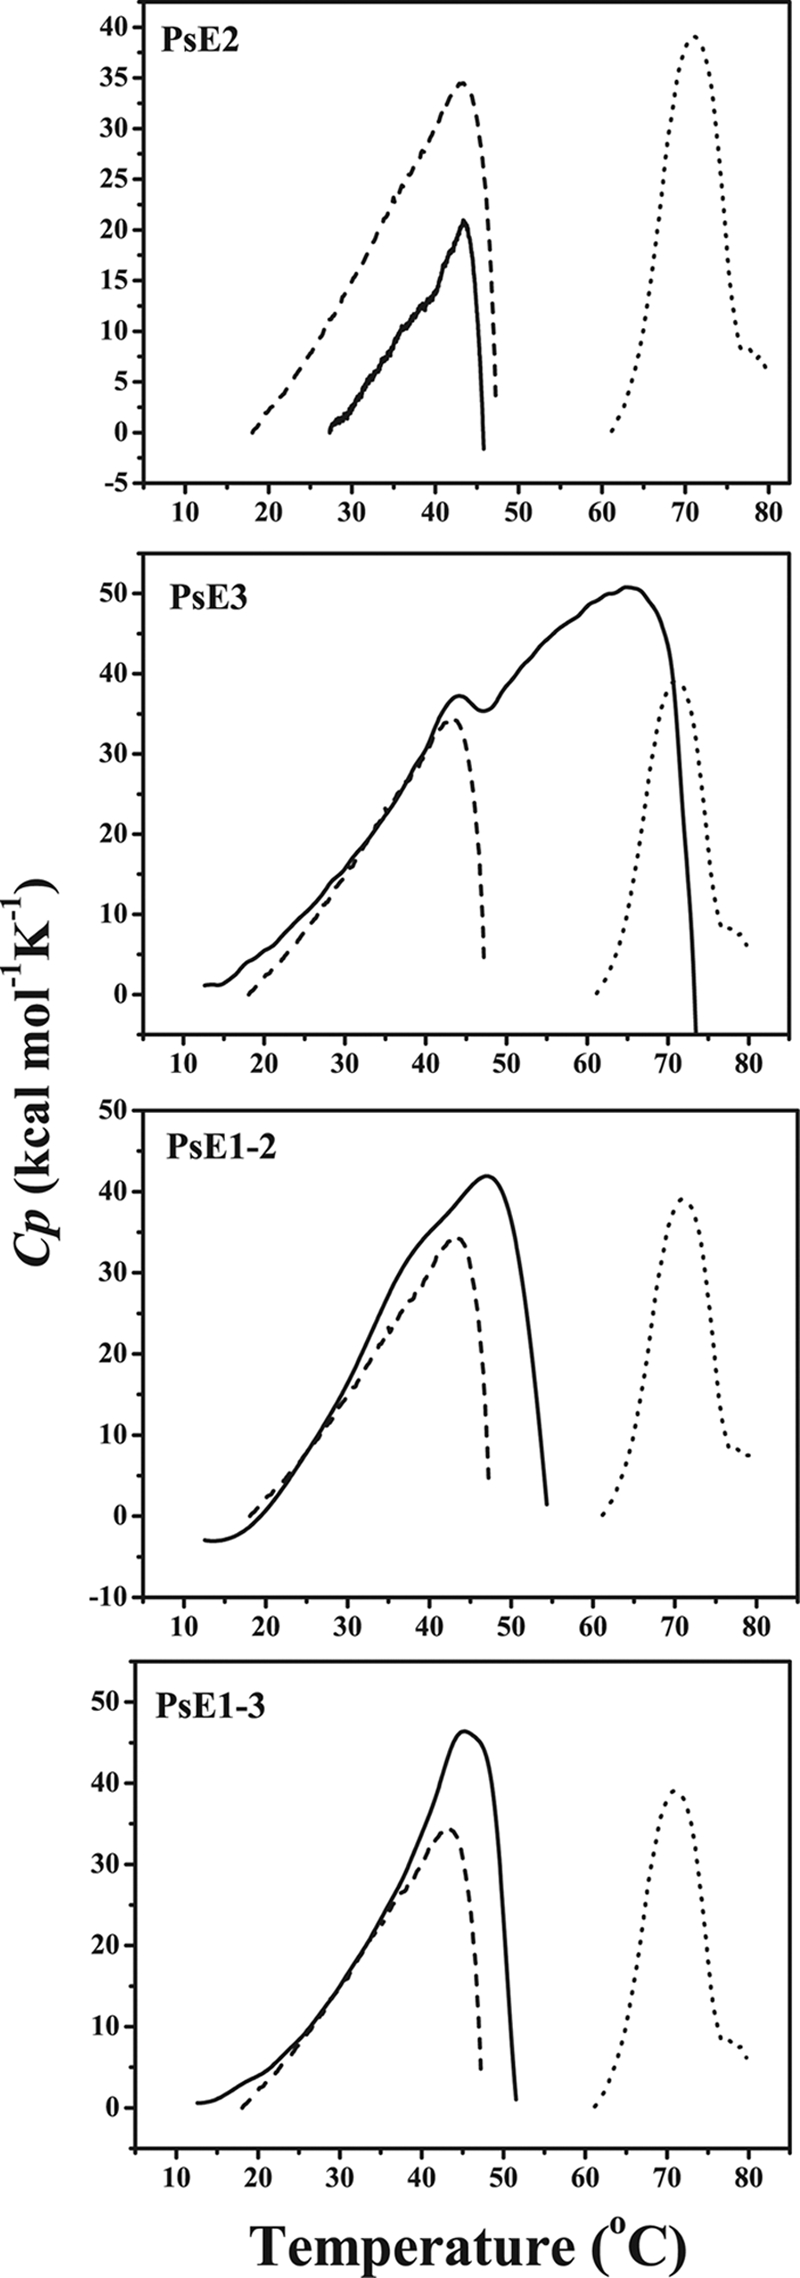
FIG. 6.

Thermal unfolding of domain-exchanged mutants. Thermal unfolding curves of the mutants PsE2, PsE3, PsE1-2, and PsE1-3 (solid lines) detected by DSC with a protein concentration of ∼1 mg/ml in 25 mM phosphate buffer (pH 7.5) compared to those of PsDppA (dashed line) and EcDppA (dotted line). Each sample was evaluated three times, and the same result was obtained each time.
