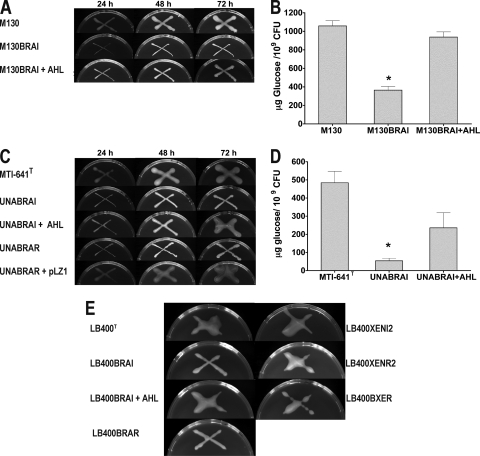
FIG. 5.
EPS Production of B. kururiensis M130 (A and B), B. unamae MTl-641T (C and D), and B. xenovorans LB400T wild-type and QS mutants (E). Single colonies were streaked in YEM agar plates. Chemical complementation was achieved by adding 1 μM AHL to the growth medium. Bar graphs show EPS quantification for B. kururiensis and B. unamae by using the boiling phenol method (described in Materials and Methods). Experiments were performed in triplicate, and means ± the standard deviations are plotted. ANOVA in combination with Dunnett's post-test was performed using Prism 4.0 software (GraphPad). A P value of <0.05 was considered significant.

