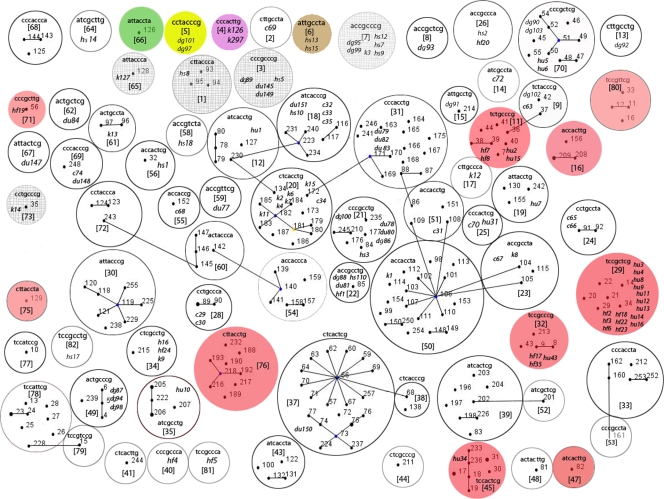
FIG. 1.
Combined output of an eBURST analysis of E. coli STs from an MLST database and SNP profiles from SEQ isolates. Single-locus variants (STs that differ at 1/7 MLST alleles) are depicted by straight lines. Each circle represents a separate SNP profile. Each SNP profile is an 8-character “barcode” which indicates a particular SNP genotype (listed in an order of increasing discriminatory power): fadD(234) (D = 0.63), clpX(267) (D = 0.8), uidA(138) (D = 0.88), clpX(177) (D = 0.92), clpX(234) (D = 0.93), lysP(198) (D = 0.94), icdA(177) (D = 0.95), and mdh(450) (D = 0.96). SNP profile numbers were assigned to each individual barcode. All of the 114 SEQ isolates genotyped in this study are shown in italics and originated from cows (c), dogs (d), ducks (du), kangaroos (k), horses (h), human feces (hf), and human urine (hu). Host-specific SNP profiles are shaded in green for cattle, yellow for dogs, brown for horses, magenta for kangaroos, and pink for human E. coli. Animal-specific SNP profiles are depicted as hashed circles. SNP profiles with isolates originating from both animal and human sources were considered mixed and remain uncolored.

