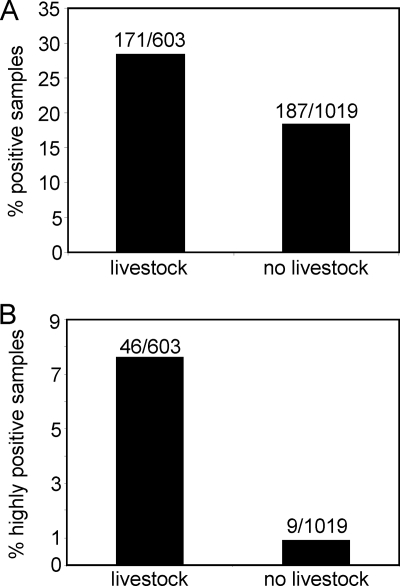
FIG. 3.
Percentage of Coxiella-positive samples that were taken from locations that had livestock or taken from locations without livestock. This analysis was done on all samples (A) and on highly positive samples (B). Samples were defined as highly positive if they had a CT value in the IS1111 PCR assay of less than 34. For statistical analysis, the data were entered into a two-by-two table, and the Pearson's chi-square values were 22.06 with a P of <0.00001 for panel A and 52.62 with a P of <0.00001 for panel B. The values above the bars indicate the number of positive samples/number of samples tested.

