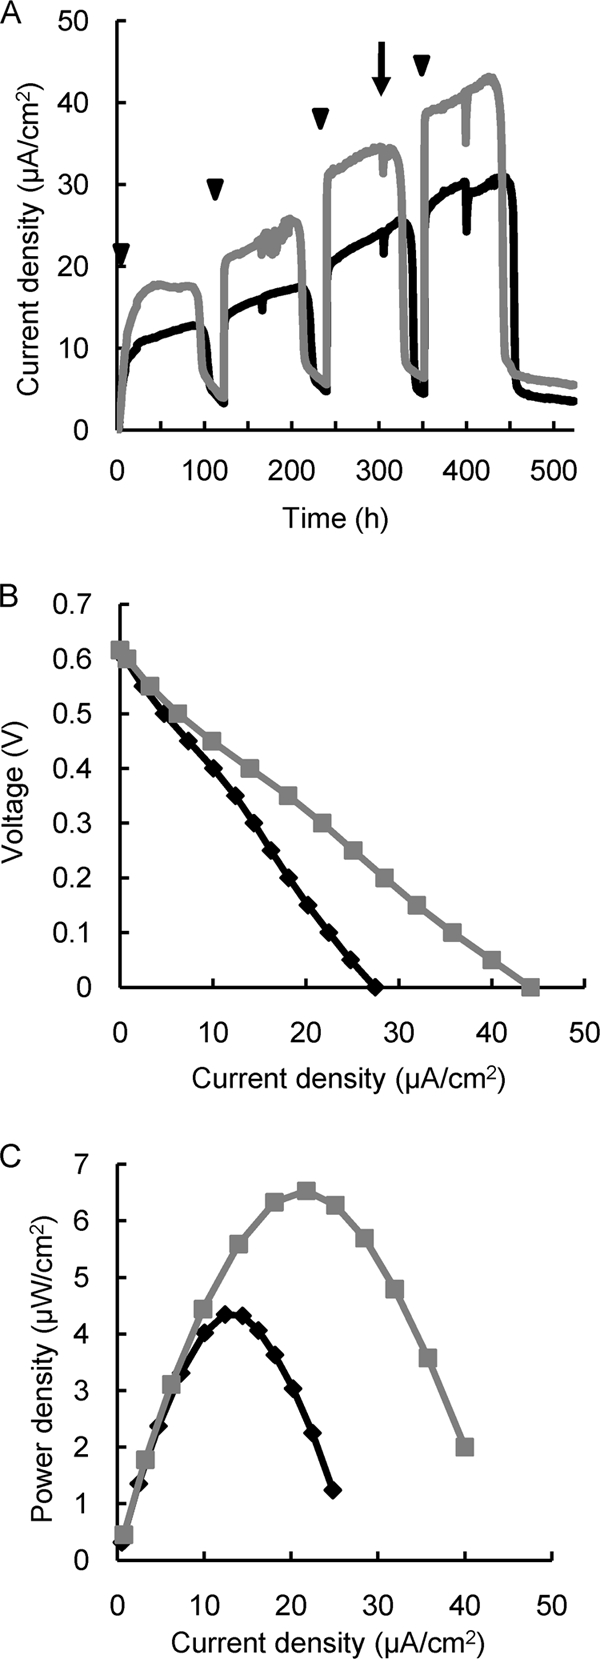
FIG. 3.

Current generation by mutant 4A and wild-type MR-1 in single-chamber MFCs. (A) Comparison of current density between MR-1 (black line) and 4A (gray line). (B and C) Polarization (B) and power (C) curves were measured at the time point indicated by the arrow. Arrowheads indicate time points at which lactate (10 mM) was injected into the MFCs. Reproducibility was examined in at least three independent operations, and typical data are shown.
