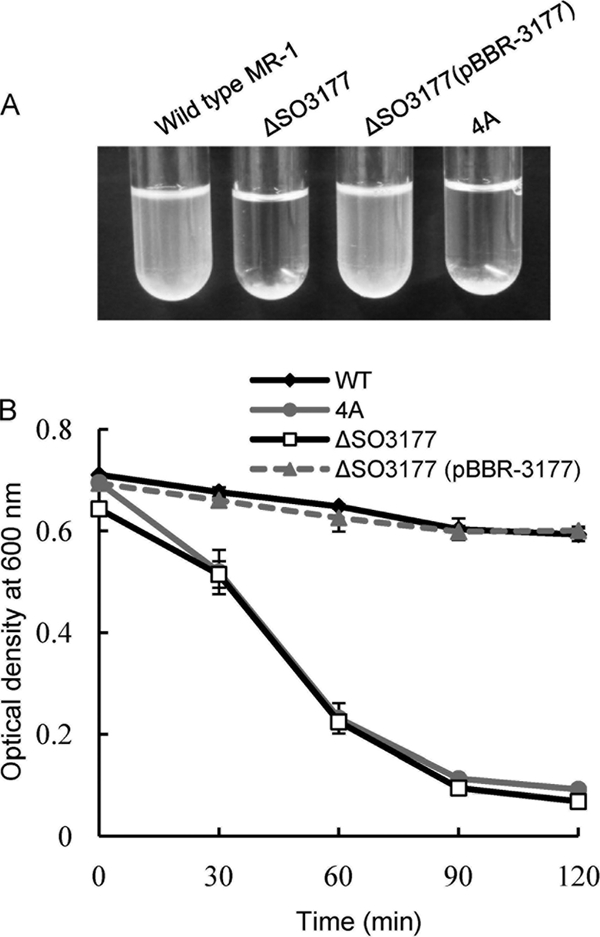
FIG. 6.

Autoaggregation of the wild-type MR-1 and two mutant strains. (A) Typical appearances of test tubes at 2 h after the incubation began. (B) Time courses of OD600. Error bars represent standard deviations that were calculated from triplicate assays.
