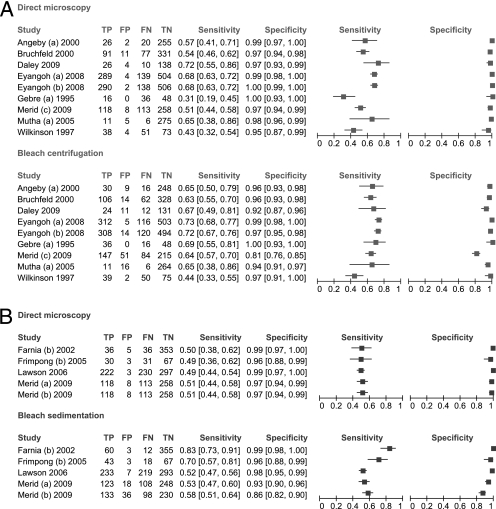
FIG. 2.
Forest plots of sensitivity and specificity. The forest plots show the number of true-positive (TP), false-positive (FP), false-negative (FN), and true-negative (TN) microscopy results for all studies comparing direct microscopy and bleach centrifugation (A) or direct microscopy and bleach sedimentation (B). For each study, sensitivity and specificity were calculated using mycobacterial culture as a reference standard. The values in brackets in the sensitivity and specificity columns are 95% CIs.

