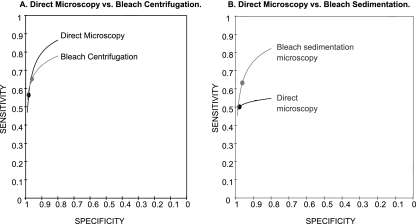
FIG. 4.
HSROC curves. Pooled sensitivity (black dots) and specificity (gray dots) estimates were calculated using HSROC analysis for all studies comparing direct microscopy and bleach centrifugation (A) or direct microscopy and bleach sedimentation (B). (A) The HSROC curves for the two tests were nearly overlapping, indicating that neither test was superior. (B) The HSROC curve for bleach sedimentation microscopy was entirely above the curve for direct microscopy, suggesting that it has superior diagnostic accuracy. Of note, any comparison of tests between the two graphs is not valid.

