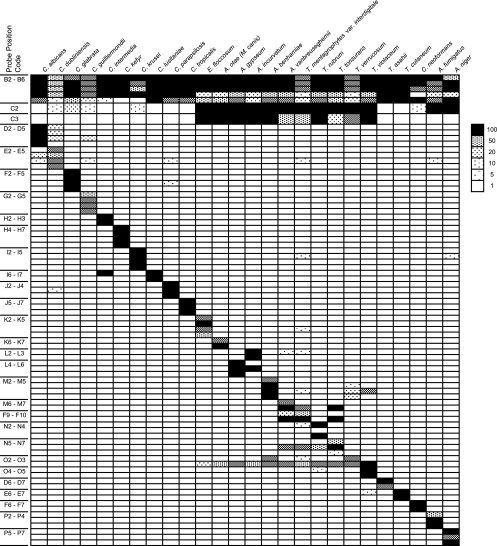
FIG. 2.
PCR-DM specifically identifies 26 targeted fungal species. Normalized signal intensities of all hybridization experiments are listed by probe position and fungal species. Signals were normalized by dividing each absolute value by the background values. Averages were then taken from duplicates or triplicates within a chip and then the average of chip replicates from the same experiments. Normalized signal intensities of 1-, 5-, 10-, 20-, 50-, and 100-fold are indicated in the different pattern images. The abbreviations for the probe names are listed in Fig. 1.

