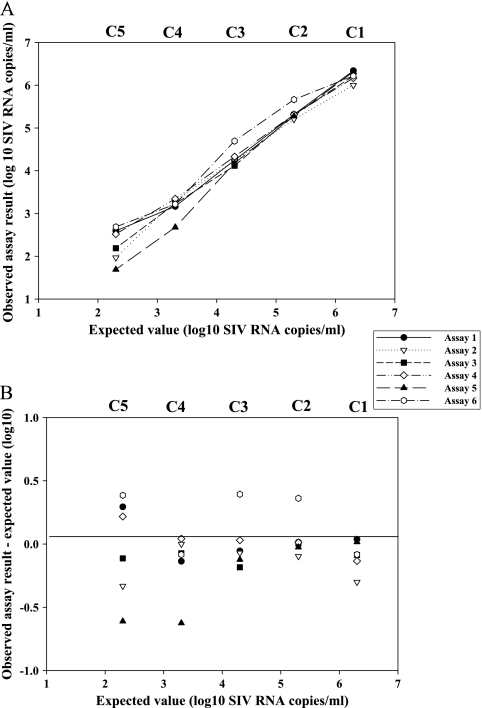
FIG. 1.
(A) Comparison of SIV RNA levels evaluated using six different assays for the quantification of plasma viral load. Estimated copies/ml (log10) for each assay are plotted against the nominal or expected value of SIV RNA copies/ml (log10) for the panel members (C1, 6.3 log10; C2, 5.3 log10; C3, 4.3 log10; C4, 3.3 log10; C5, 2.3 log10) for each of the six assays: assay 1, qRT-PCR; assay 2, conventional qRT-PCR; assay 3, qRT-PCR; assay 4, qRT, assay 5; qRT-PCRv; assay 6, qRT-PCR (see Table 1 for details). (B) Difference between the observed estimated copies/ml (log10) and the expected nominal value copies/ml (log10) plotted against nominal expected copies/ml (log10) for individual assays (1 to 6) across panel members (C1 to C5).

