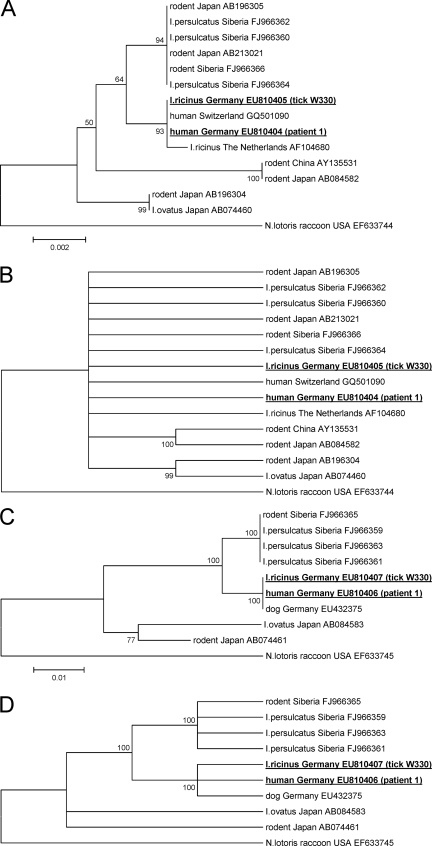
FIG. 1.
Phylogenetic tree of the 16S rRNA (A, B) and groEL (C, D) gene sequences inferred using the neighbor-joining method. Bootstrap values are shown next to the nodes of the trees. The scale bar indicates the number of base substitutions per site. The final data sets contained 1,293 and 968 positions, respectively. Following the sequence names are the respective GenBank accession numbers. The accession numbers of sequences newly reported in this study are in bold and underlined (tick W330 and patient 1; the sequence data for patient 2 are not depicted because they did not fulfill the minimum length requirements for phylogenetic comparison to other published sequence data). The condensed trees (B, D) were calculated by applying a cutoff value of 95%.

