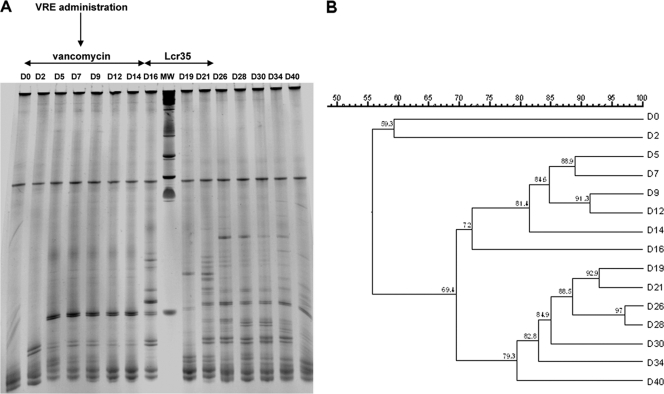
FIG. 3.
TTGE analysis of 16S rRNA (V6 to V8) amplification products from feces samples collected over time (40 days) of mice receiving vancomycin (D0 to D14) followed (test group) or not (control group) by daily administration of Lcr35 (D15 to D21). Representative example of TTGE community profile (A) and its phylogenetic tree constructed using Dice's coefficient (B) of an animal from the test group. The periods of vancomycin and probiotic administration are indicated by horizontal double arrows, and VRE gastric inoculation is indicated by a vertical arrow. MW, molecular weight markers.

